You can turn your raw data into a clear insight that drives smarter decisions? Do you know how? Well, it can be done through data visualization. It is found that data grows faster nowadays where business needs clarity and not confusion. Now, this is the place where data visualisation plays an important role by converting complex data into visuals like charts and graphs. So, if you are planning to build skills, a data analyst course online kolkata can help you learn practical tools and real-world applications. Now, let us understand in this blog what data visualisation is in analytics.
Data visualization is a graphical representation of data and information. It includes a dashboard, charts and graphs. It further provides an excellent way to the business owner and the employees to present data in an organised way. This makes the work easier and users can see the insight easily. Let's take an example.
Data alone cannot help for which clear presentation is required. Now let us explore its beneficiary aspect.
Well, companies rely on visuals which makes them take faster decisions.
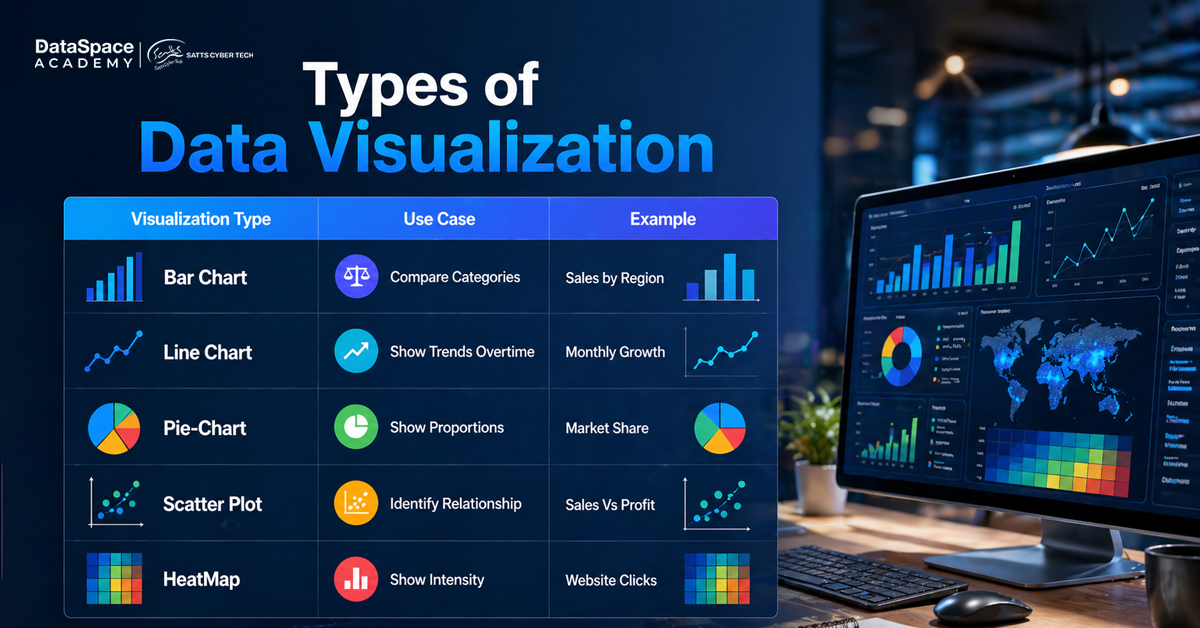
There are different types of visualization where the most common types are mentioned below.
| Visualization Type | Use Case | Example |
| Bar Chart | Compare Categories | Sales by Region |
| Line Chart | Show Trends Overtime | Monthly Growth |
| Pie-Chart | Show Proportions | Market Share |
| Scatter Plot | Identify Relationship | Sales Vs Profit |
| HeatMap | Show Intensity | Website Clicks |
Understanding data visualization techniques helps you to present data effectively. Some of the techniques are stated below.
These techniques help in improving readability.
Professionals use modern tools to create powerful visuals. Some of the tools are-
Many learners join data analytics training kolkata to gain hands-on experience with these tools. Practical learning improves job readiness and confidence.
Learning data visualization requires structured guidance. A well-designed course helps you understand tools and real-world applications. At DataSpace Academy learners gain practical exposure to dashboard, report and chart. This approach improves both analytical and technical skills. Now you can also opt for certification in data analytics and enhance your career.
 Suppose a retail company is tracking a sales performance. If the company does not use visualization then there will be-
On the contrary, if visualization is used then-
This helps in improving decision making in a given point of time.
You need both creative and technical skills. Some of the important skills include-
Thus, a structured program helps learners build these skills step-by step.
The data visualization skills opens career path like-
Companies across different industries look for skilled professionals for which its demand rises.
Suppose a retail company is tracking a sales performance. If the company does not use visualization then there will be-
On the contrary, if visualization is used then-
This helps in improving decision making in a given point of time.
You need both creative and technical skills. Some of the important skills include-
Thus, a structured program helps learners build these skills step-by step.
The data visualization skills opens career path like-
Companies across different industries look for skilled professionals for which its demand rises.
Data Visualization makes data meaningful and actionable. It helps the business to understand the insight quickly and make strategic decisions. As the industries depend on data, this skill becomes essential for every analyst. If you want to build a strong career, start with a data analyst course online Kolkata. In this respect, learning the right tools and techniques at DataSpace Academy provides you structured learning and practical exposure. It further helps you grow in this field and lead a better career.
So, start learning data visualization and turn data into powerful insights.
FAQs
It helps in presenting data in graphs and charts for a better understanding.
It helps people to understand data quickly.
The common tools are Tableau, Power BI, Excel and Python.
You need analytical thinking and tool knowledge.
A bar chart works best for comparing different categories