loader

Home >blog > top 5 data visualization trends in 2025

Top 5 Data Visualization Trends in 2025

Top 5 Data Visualization Trends in 2025

Published On: 18 Nov 2024

Last Updated: 18 Nov 2024

Views: 2.2K

Introduction

With 2025 around the corner, data is taking on a bigger role in business strategy and planning than ever before. Companies are fast realising that data-driven decisions are key to surviving the competitive and dynamic business landscape. With data becoming a cornerstone of business strategy, the ability to communicate insights effectively is essential. Data visualisation offers an accessible way to present complex data through visual formats that makes the insights easily legible even for the non-technical workforce.
In this post, we’ll break down the data visualization trends to watch out for in the upcoming year. Think augmented analytics, real-time decision-making, and much more. These aren’t just tech buzzwords but essential shifts reshaping how businesses use data to gain a competitive edge.

Significance of Data Visualisation

In the modern business landscape, data visualisation plays an essential role in helping companies recognise trends swiftly, removing the guesswork. Pictorial transformation of data makes data insights easily legible for all, empowering analysts to discover new patterns and ideas easily. Given the daily explosion of data, handling immense quantities would be nearly impossible without the help of data visualization. Now more than ever, industries across the board are banking on visualisation techniques to deepen their data insights - considering the prospect of data visualization future scope.
This method allows for clearer communication of findings, ensuring companies can capitalise on the value of their data.
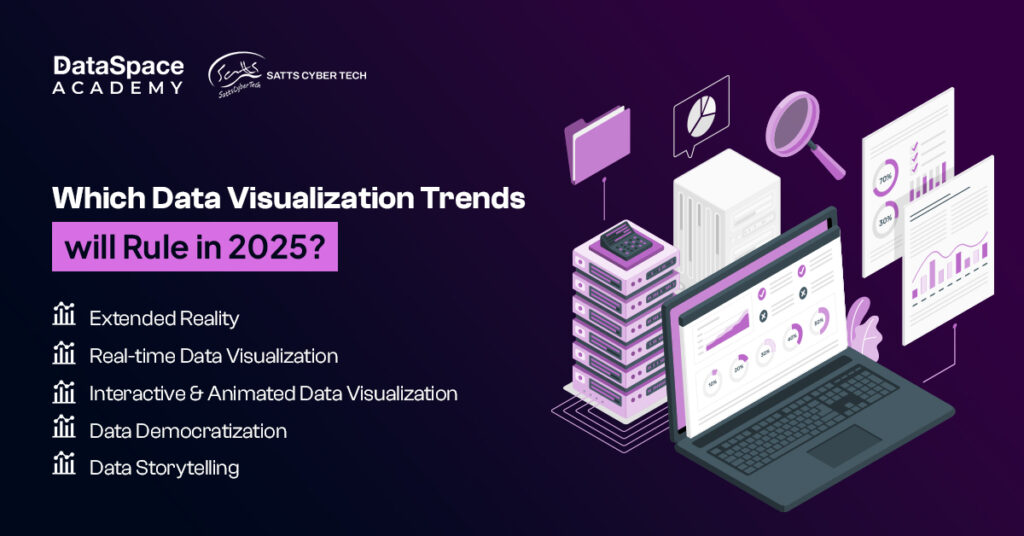
Which Data Visualization Trends will Rule in 2025? Let’s explore 5 emerging data visualization future trends all set to multiply business growth in 2025.

      1. Extended Reality (XR):

      2025 will witness a transformation of the visualisation landscape through futuristic concepts like Virtual Reality (VR), Augmented Reality (AR), and Mixed Reality (MR). By combining technologies like VR with traditional data visualization tools, data professionals will be able to make efficient use of virtual spaces - instead of complicating things with multiple screens or tabs for data visualisation.
      In other words, the coming year, data visualisation will get a ‘realistic transformation’ rather than a mere representation of graphics and bars.

      2. Real-time Data Visualization:

      AI incorporation in data visualization could usher in a transformative approach in 2025 as it allows algorithms to process, prioritise, and refine search results. This approach speeds up the process of finding answers with enhanced accuracy - enabling organisations to make quicker and more efficient risk management strategies, leading to more reliable insights.

      3. Interactive and Animated Data Visualization:

      2025 is predicted to witness more focus on interactive elements like animations and transitions to make the data insights more appealing and captivating. In an era filled with endless information, it’s essential to find ways to grab attention and make your insights memorable. Adding interactive data visualizations, such as dashboards featuring animated charts, 3D elements, scroll effects, counters, buttons, and other interactive tools- makes the overall experience more immersive and visually striking.

      4. Data Democratization:

      Data visualisation and analytics will no longer be restricted to professional analysts. Rather, the coming times are expected to see a strong wave of data democratization, unleashing easy access to data even for non-technical persons.
      Data democratisation is a welcome move as it will help to reduce dependencies and promote a data-centric culture. Tableau is one such tool that offers no-cost data visualisation techniques for all.

      5. Data Storytelling:

      Data visualization will have a simplified avatar with data storytelling. This approach will continue to be a transformational factor in 2025 for representing data in an eye-catching and engaging format.

2025 is expected to be a rewarding year offering top-paying data visualization jobs for freshers as well as for experienced professionals.
Here is a glimpse of top data visualization career choices in 2025.
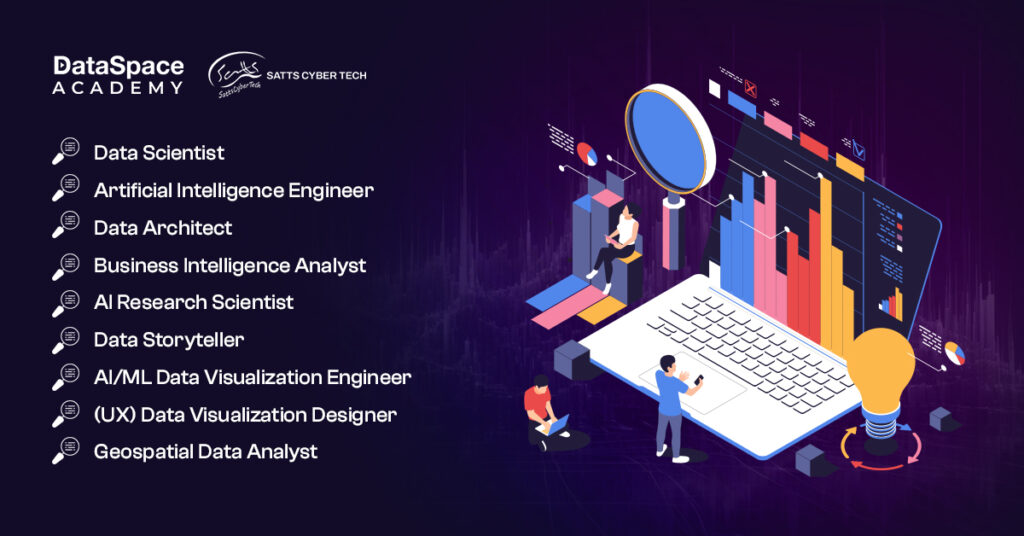
data visualization career

Conclusion

As 2025 approaches, data visualization trends continue to evolve, emphasising interactivity, AI integration, and immersive graphics. Mastering these skills through a data visualization course online can greatly enhance your profile. With organisations prioritising data-driven insights, these in-demand skills are crucial for standing out and building a rewarding career in a competitive market.
Talk to Our Counsellor

Get In touch

Talk to our Career Experts

You agree to our Terms of Service and Privacy Policy.

Share This Article

FacebookLinkedinWhatsappTwitter XPinterestQuora
Certification in Data Science

Certification in Data Science

Recommended

Recommended Articles