Feeling overwhelmed by the data analytics toolscape? You’re not alone. With Gartner naming both Microsoft Power BI and Tableau as leaders, and Excel evolving into a powerful contender with automation, many learners struggle to choose between
Power BI vs Tableau vs Excel. This guide doesn’t aim to declare a winner—it helps you identify the right
data analysis courses in Kolkata to fast-track your career. Let’s explore the current market trends and choose the business intelligence tools that align with your goals.
Choosing the right business intelligence tool is just as important as learning data analytics itself. The path may seem overwhelming with so many data visualization tools and BI tools mentioned as the core credentials for high-growth data analytics job roles.
Power BI vs Tableau vs Excel—each of these feature-rich BI tools are significantly used for different purposes, such as quick reporting, advanced visualization and strategic decision-making.
For aspiring and working professionals in Kolkata, understanding which tool aligns with which industry needs can make a significant difference in your career growth.
With Kolkata emerging as a prospective IT hub, accelerating high-growth job roles in finance and analytics roles, enrolling in the right
data analytics course in Kolkata can help you build practical skills that match real-world job expectations.
Today’s data analytics market is evolving rapidly, and employers are looking for advanced tools-proficient professionals with business acumen. To gain a competitive-edge, enrolling in a reputed
data analytics training institute Kolkata can equip you with the following skills:
Choosing the best data analytics course not only validates your skill to employers but also adds a competitive edge to your resume.
Excel is the popular, most dependable, and powerful foundational tool in data analysis. With increased uses, Excel has evolved from a dependable data visualization tool to a powerful BI tool enhanced with AI.
Excel is widely used across industries for MIS and business analysis. Most learners in a
data analyst course in Kolkata
start with Excel and then proceed to advanced platforms.
Tableau is the 2nd most used data visualisation tool for creating interactive and attractive dashboards. The tool is preferred by organisations that tell stories through data.
Tableau skills are valuable for roles focused on data visualization, business intelligence, and reporting.
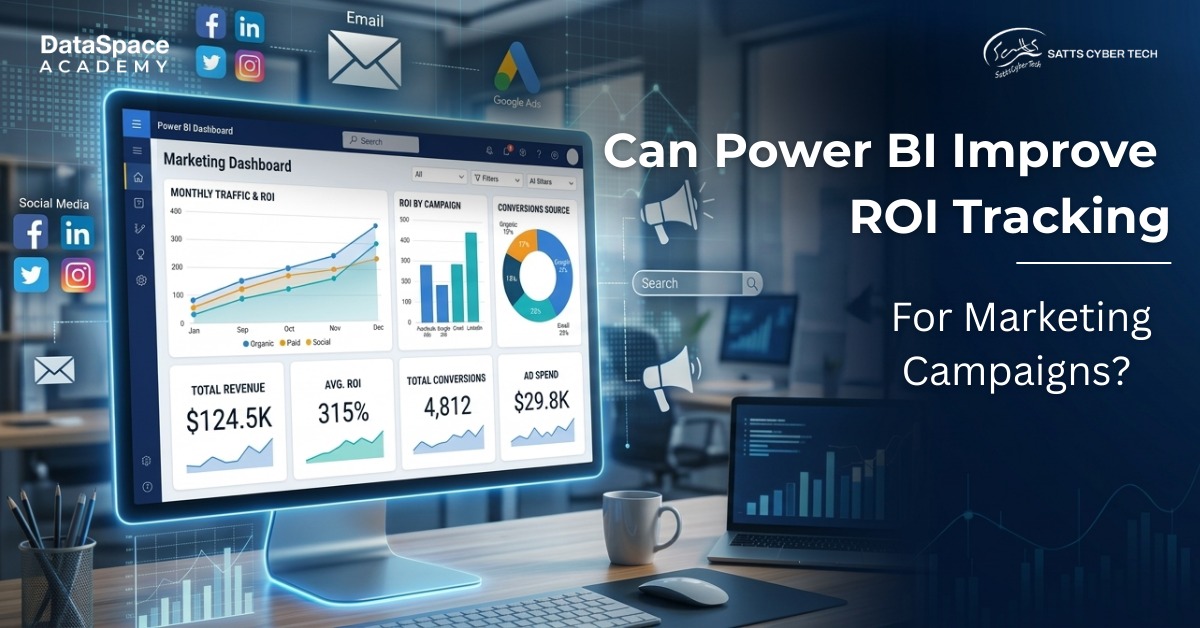
Microsoft’s Power BI is a popular business intelligence tool designed for end-to-end data analysis, modeling, and visualization. It is widely adopted by organizations for its affordability and strong integration.
Power BI is one of the most in-demand data analytics skills in 2026 and beyond. This is why modern data analytics professionals enroll in
data analyst courses in Kolkata to gain a competitive edge with Power BI proficiency.
The soaring importance of data analytics as a career-critical skill has significantly led to the mushrooming rise of data analytics training institutes. This is where learners encounter confusion in choosing a reputed platform that imparts quality job-ready training.
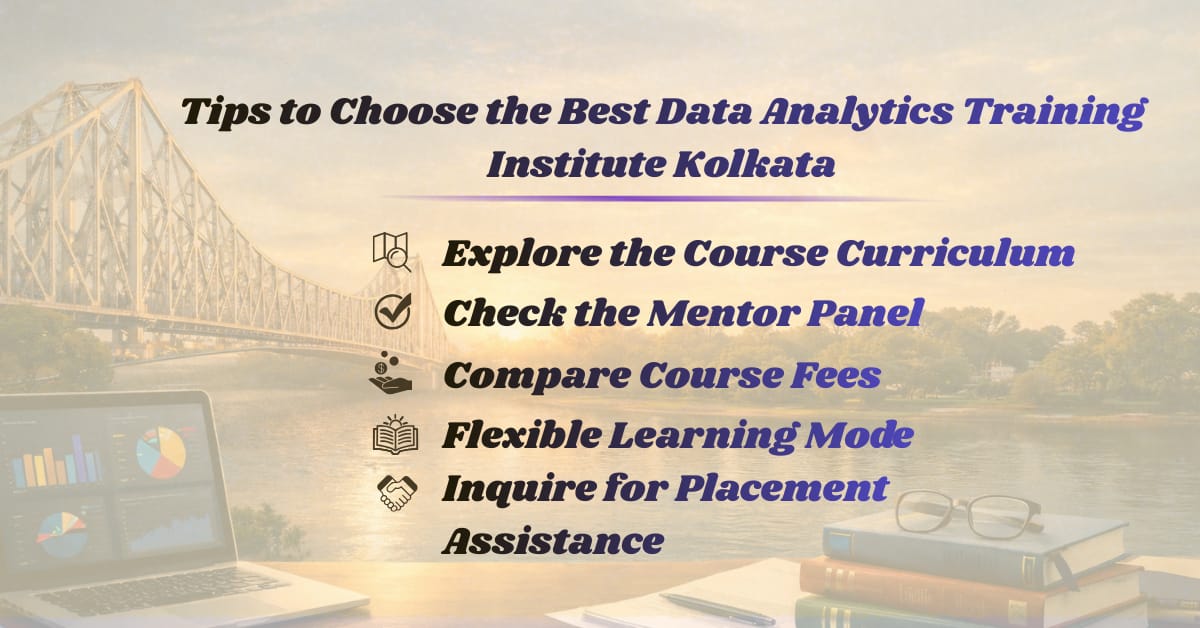
Here is your simple checklist for the best search that aligns with your goals and budget.
 Explore the Course Curriculum:
 Whether you make your choice online or offline, the first thing to do is thoroughly check the curriculum. This one step will give you a deeper dive to understand if the course covers in-demand tools and platforms, offers capstone projects, and hands-on learning—crucial to boost your employability.
Check the Mentor Panel: Evaluate the list of mentor panels to gain an overview of the quality of training you can expect. Another best way to validate the mentor panel is to check for online reviews, preferably the current ones to confirm selection or rejection.
Flexible Learning Mode: Institutes now offer flexible learning options to suit every learner’s needs—online, offline, and hybrid. The hybrid mode combines the convenience of remote learning with the benefits of classroom sessions.
Compare Course Fees: Always be vigilant of the course fees both online and offline. Remember, the pricing of the course depends on various factors such as course offerings, duration, and certification.
Inquire for Placement Assistance: Make sure your choice of academy offers end-to-end placement assistance—starting from resume & portfolio building, social media profile optimization, mock interviews to assist you in getting placed.
Finding the best data analysis courses in Kolkata can be overwhelming considering the diverse options available in today’s market. But choosing the right one can significantly impact your career trajectory. Choosing the right program won’t just teach you concepts but build confidence, skills, and job readiness—crucial to navigate the competitive job market confidently.
Learn more.
Among these leading BI tools, Excel emerges as the most popular beginner-friendly platform for data analytics, now powered with AI-enhanced features.
When it comes to data visualisation, Tableau tops the list, followed by Power BI and Excel. The tool is best suited for highly customizable data storytelling.
Excel is hands down the most low-cost option for excellent data visualisation, powered by its widest range of standard charts, graphs, and PivotTables, making it ideal for small-to-medium datasets.
The soaring importance of data analytics as a career-critical skill has significantly led to the mushrooming rise of data analytics training institutes. This is where learners encounter confusion in choosing a reputed platform that imparts quality job-ready training.