loader

Home >blog > tableau tool features advantages and more

Tableau Tool – Features, Advantages, and more

Tableau Tool – Features, Advantages, and more

Published On: 27 Dec 2023

Last Updated: 08 Jan 2024

Views: 1.2L

Introduction

Businesses around the world are struggling with a humongous data set. And most of it is cluttered data. Thus, it becomes extremely cumbersome for professionals to analyse this vast set of raw data. The Tableau tool comes to the rescue here. One of the most popular data science tools, Tableau facilitates the simplification of raw data in an easily comprehensible format. The tool also helps to create a customised dashboard, as per the specific demands of a business. Developed by a leading data visualisation company, Tableau is widely utilized by data scientists for data exploration across the world.

Key features of Tableau

Some of the unique features of Tableau that make it one of the most sought-after tools for data analysis are:
    • Analysis Speed Tableau supports faster data analysis in comparison to many other data science tools. The tool does not require any coding expertise and can be used by anybody with basic computing knowledge.
    • Visual Discovery Tableau users can analyse and explore data with multiple visual tools like graphs, charts, and colours. Additionally, the drag-and-drop option allows a seamless operation.
    • Real-time Collaboration The interactive dashboard in Tableau enables to filter, discuss, and sort data which can be easily embedded into the live dashboard, such as Salesforce.
    • Centralised Database The centralised location of Tableau helps in managing published data sources in an organization.
    • Numerous sources of Data One of thye most beneficial features of Tableau is that it is compatible with multiple data sources.
    • Customisation Facility Tableau allows easy customisation of dashboard and visualisation, tailored as per needed business requirements. The tool is also compatible with APIs and extensions for ever greater customisation.

Data visualisation in Tableau

Data visualisation refers to pictorial representation of the data and information with charts, graphs, and maps. Put simply, the visualisation methods help to showcase the data interestingly and effectively.
Tableau’s data visualisation feature portrays an easy understanding of patterns, trends, insights, and connections throughout the database.
Some of the types of visualization techniques are as follows: Data Visualisation Formats of Tableau
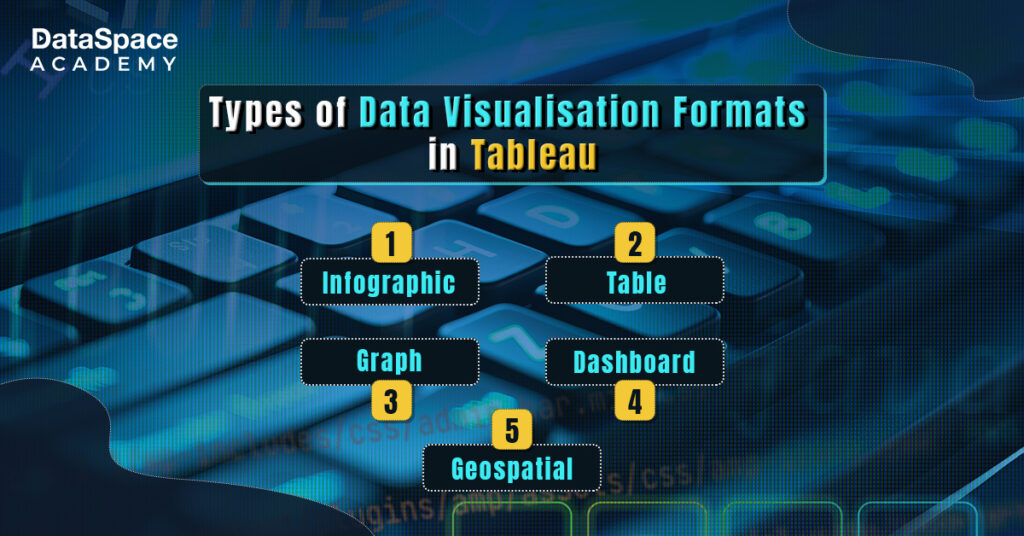
    • Infographic This includes a combination of words and visuals for data representation. This is mainly done with diagrams or charts.
    • Graph The diagram of curves, segments, and lines gives a representation of variables along the two axes.
    • Table The table represents the data set in the form of columns and rows.
    • Dashboard This includes a visualisation set that can display data in a single place. In other words, dashboard visualization allows an easily legible format for presenting and analysing data.
    • Geospatial As the name says, the visualisation displays data in map format. Different colours and shapes are used to explain the relationship among the locations and the data available.

How does Tableau work?

Tableau is capable of extracting and connecting to the various sources of data. The tool is capable of pulling data from multiple platforms including the database such as Microsoft Azure SQL database, Oracle database and google cloud SQL.

Advantages of using Tableau tool

Tableau is fast becoming the go-to tool for data scientists for reasons more than one. Benefits of Tableau Tool
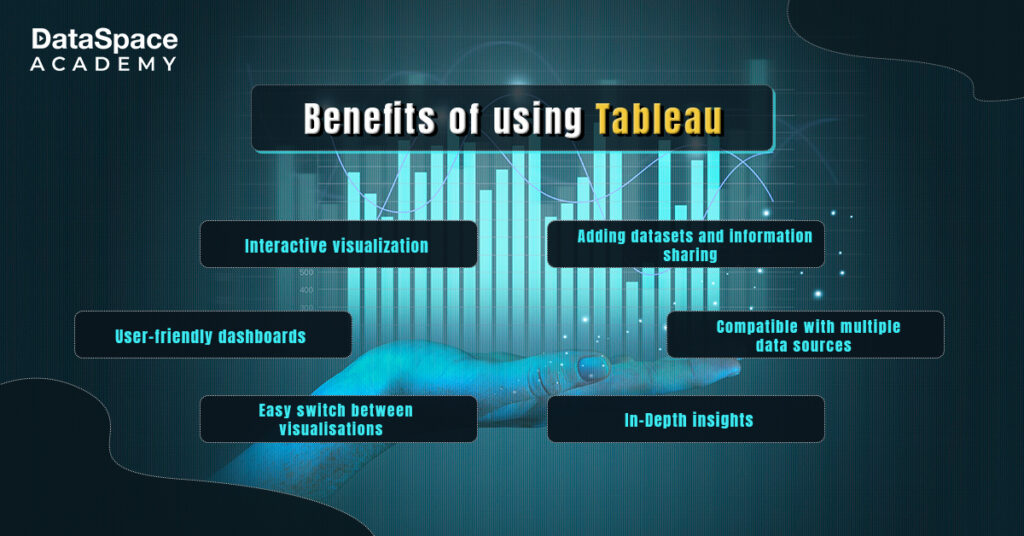
    • Interactive visualization This is one chief reason behind the wide use of tableau in data science. Tableau comes with advanced in-built features that allow interactive visualisations. Users will also be able to switch between the different visualisations to explain complicated and elaborate datasets.
    • User-friendly dashboards This is one of the major reasons why Tableau is one of the most sought-after data science tools today. Its user-friendly dashboards allow anyone to gain an understanding of the visual features of data, irrespective of their level of technical expertise. Tableau also makes tasks more effortless with a breezy drag-and-drop feature. This eventually helps to ensure more streamlined data visualisation and better communication of gathered insights.
    • Easy switch between visualisations The Tableau tool allows users to switch between various types of visualisations such as graphs or charts. This is especially helpful when you are dealing with diverse kinds of data for which one particular visualisation format won’t be sufficient.
    • Adding datasets and information sharing Tableau makes adding datasets easy by automatically blending the common fields.
    • Compatible with multiple data sources The analytics and business intelligence features of Tableau allow better connection of data sources files and data warehousing. This helps to create an interactive and compelling visualisation.
    • In-Depth insights One of the best advantages of Tableau is that it allows in-depth insights that help to assure “informed” business decisions. Tableau helps in future analysis of data and dynamic addition of components. This also supports work in real-time.

With a wide range of features and visualisation, Tableau is one of the commonly used tools in the data analytics domain. However, there are still some of the popular competitors of Tableau:
    • MicroStrategy
    • Qlik Sense
    • Oracle Analytics Cloud
    • Power BI
    • Metabase

Conclusion

Summing up, Tableau is one tool that every data scientist or analyst should master. Its interactive visualisation facility and user-friendly dashboard make it a charm to use. However, Tableau is just one of the multiple tools that data scientists need to work with. Aspiring data scientists should sign up for a credible data science course online to learn about the leading data science tools. However, you should also make sure that your chosen data science course offers hands-on training on the tools, added to the theoretical learning. Talk to Our Counsellor

Get In touch

Talk to our Career Experts

You agree to our Terms of Service and Privacy Policy.

Share This Article

FacebookLinkedinWhatsappTwitter XPinterestQuora

Recommended Articles