In today's data-driven world, the ability to effectively communicate insights from data is invaluable.
Data visualization serves as a powerful tool in this regard, allowing analysts and decision-makers to grasp complex information quickly and make informed choices.
In this article, we'll delve into the significance of data visualization, the best practices, and common mistakes to avoid.
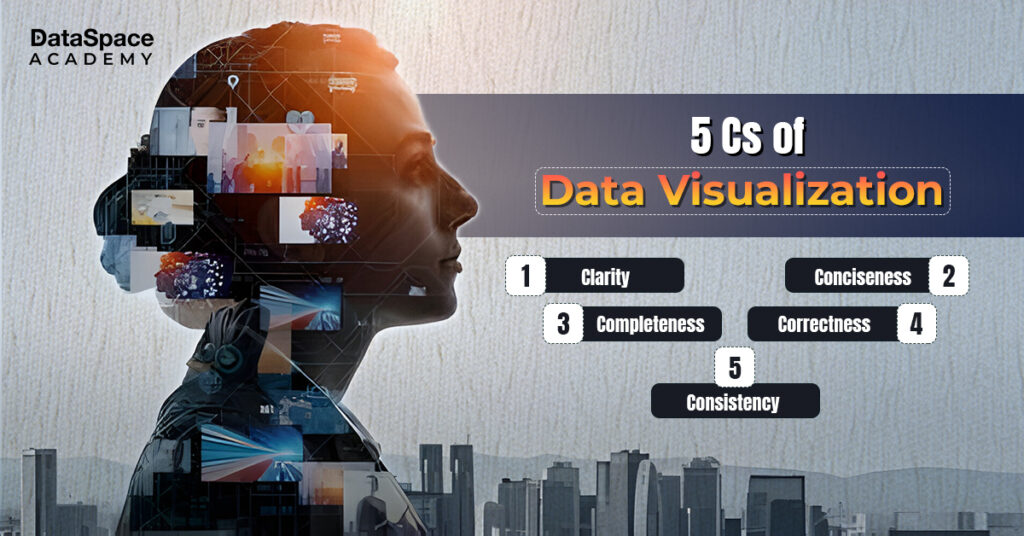
Data visualization revolves around the concept of presenting data in a graphical or visual format, making it easier to comprehend and identify patterns. The 5Cs of data visualization – Clarity, Conciseness, Consistency, Correctness, and Completeness – serve as guiding principles for creating effective visualisations. These principles ensure that
visualization techniques are both informative and engaging, enabling stakeholders to extract actionable insights effortlessly.

Data visualisation plays a pivotal role in various domains, including business intelligence, data analysis, and decision-making. By translating raw data into intuitive charts, graphs, and dashboards, organisations can uncover hidden trends, identify outliers, and communicate findings more effectively. Furthermore, visualisations facilitate collaboration and knowledge-sharing, empowering teams to align their efforts towards common goals.
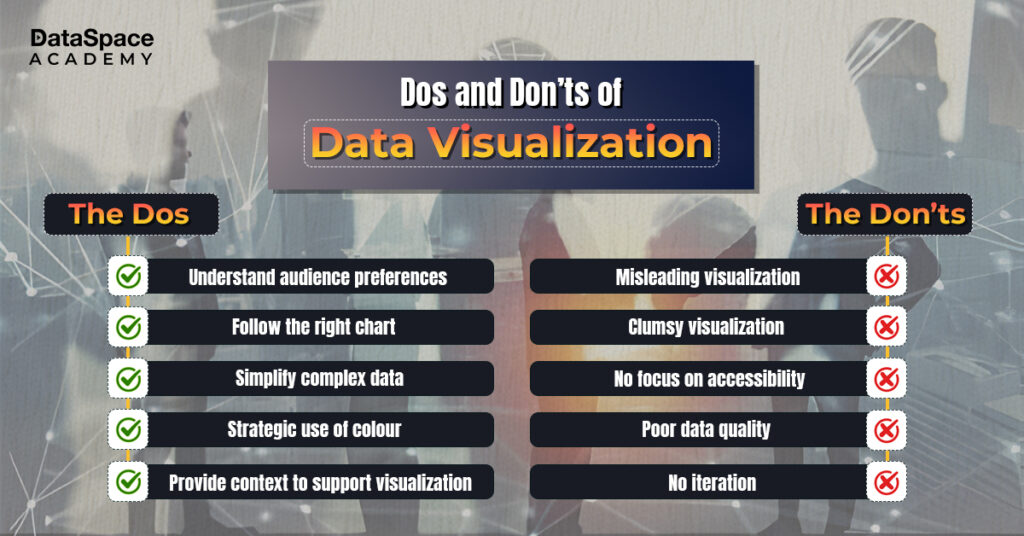
Here are some tips and tricks to optimise the effectiveness of your visualisation dashboard:

Several tools empower users to create compelling visualizations effortlessly. One standout option is
Microsoft Power BI, a renowned business analytics platform. Power BI offers a user-friendly interface, trendy visualisation features, and advanced visualisation capabilities, making it ideal for both beginners and seasoned analysts. With Power BI, users can visualise data from various sources, create interactive dashboards, and share insights across the organization seamlessly. Sign up with our
power bi training online to master Power BI for advanced data visualisation.
Apart from Microsoft Power BI, there are several other important
data visualization tools that make the process time and money-worthy. Here’s discussing a few of them.
While data visualisation can be a powerful tool, certain pitfalls can undermine its effectiveness. Below is a list of mistakes that every analyst should be aware of while creating visualisations.
To sum up, mastering data visualization requires a combination of technical expertise, creativity, and strategic thinking. By adhering to best practices and avoiding common mistakes, organisations can unlock the full potential of their data and drive informed decision-making. As the volume and complexity of data continue to grow, effective data visualization will remain a critical skill for professionals across industries.


